
Subscribe to Bankless or sign in
Dear Bankless Nation,
 Ethereum is the leading smart contract network in the world. It’s also a public good.
Since no one is formally responsible for creating status reports, Bankless strives to put out a quarterly State of Ethereum report which covers important baseline metrics across its protocol and L2 layers, as well as DeFi and NFT ecosystems.
In the past 3 months, what does network usage look like?
How many people are still buying NFTs?
Are Layer 2s successfully scaling Ethereum?
Find all these answers in a digestible report brought to you by Bankless Analyst Ben Giove.
- Bankless Team
This report looks at topline metrics for the third quarter of 2022 for the Ethereum protocol and ecosystem as broken down into four categories: Protocol, DeFi, NFT, and Layer 2. Then I move on to ecosystem highlights and a forward outlook.
Key Results
These numbers compare performance in Q3 2021 to Q3 2022.
🌐 Protocol
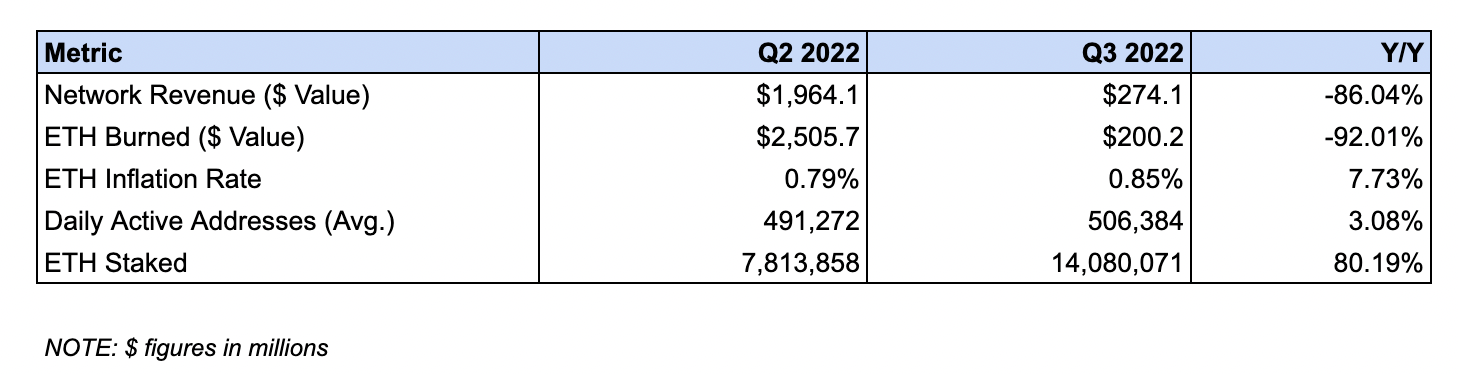
Network Revenue fell 86.0% $1.96B to $274.12M.
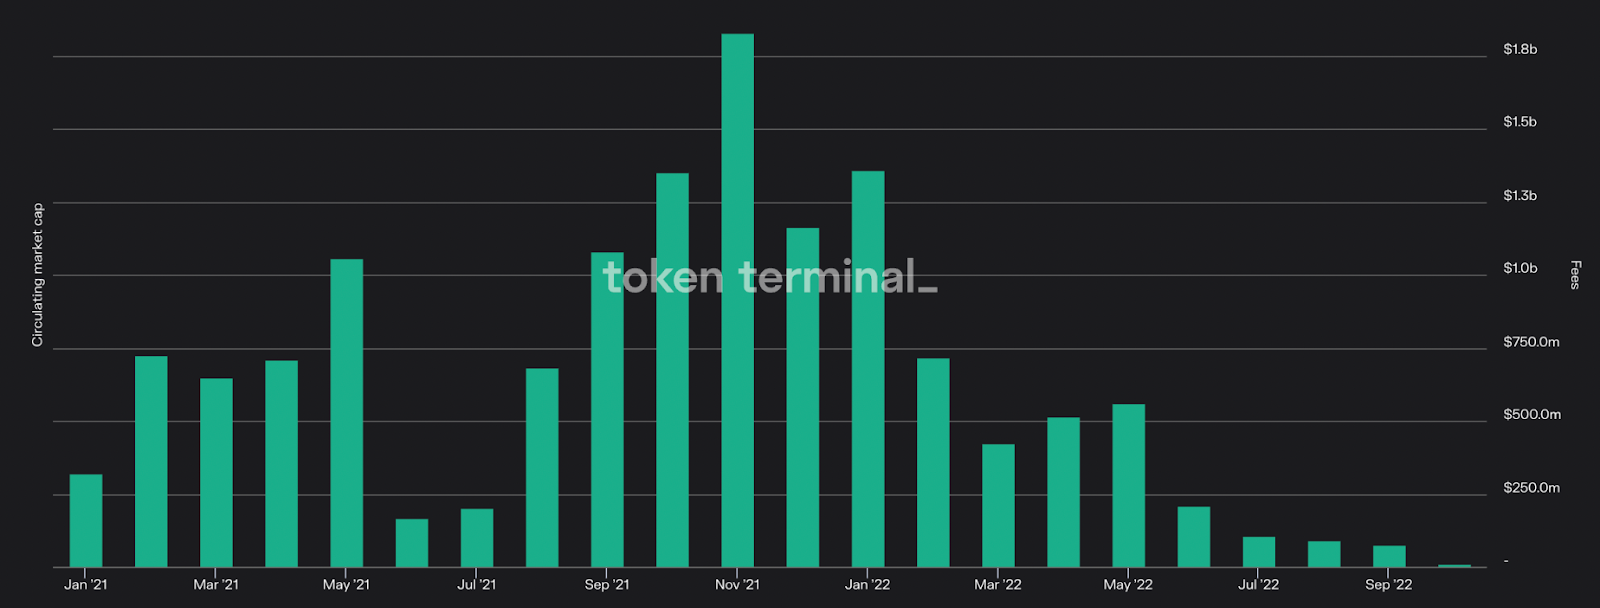
This measures the dollar value of the total transaction fees paid by users during the quarter.
This decline in net income can be attributed to a drop in on-chain activity as a result of broader weakness in the markets. There was significantly reduced demand to trade speculate, and take on leverage amidst a bearish macro backdrop during the quarter.
Of this, $200.15M (73%) was burned via the fee-burning mechanism introduced in EIP-1559.
The ETH Inflation Rate rose 7.7% from 0.79% to 0.85%.
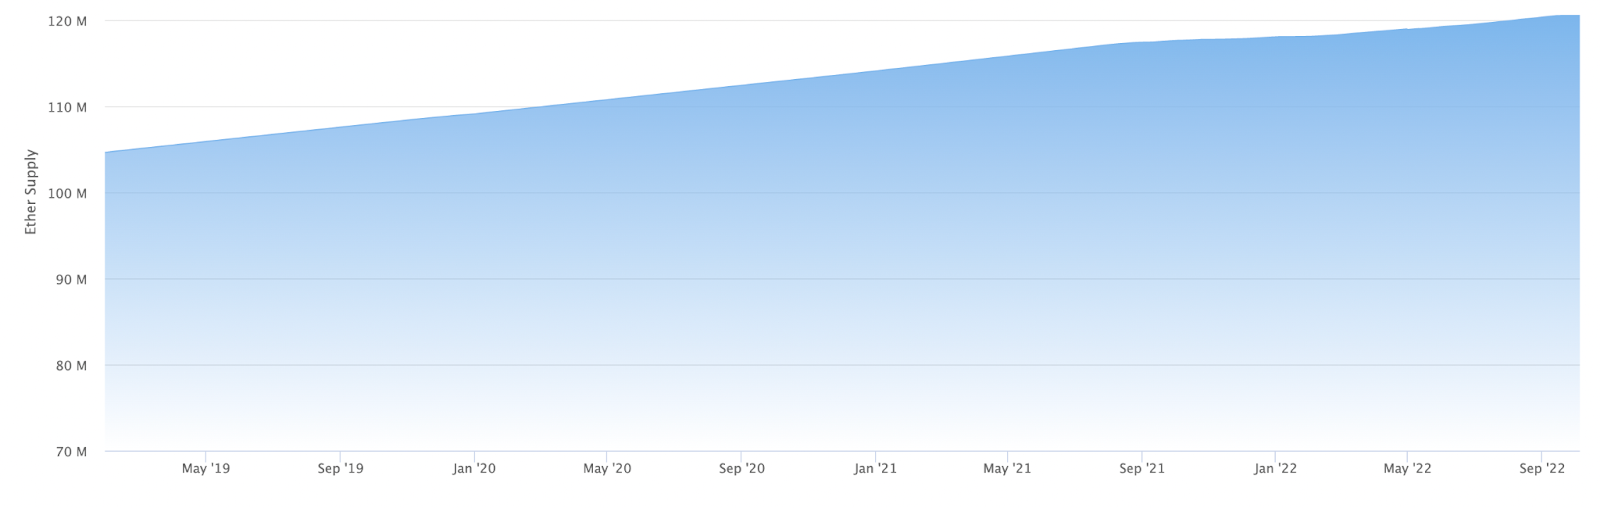
This metric measures the growth of the Ether supply during the quarter.
The increase in inflation is likely due to the reduced demand for blockspace. As users transacted less, fewer ETH was burned (permanently removed from the circulating supply) via EIP-1559.
The Average Number of Daily Active Addresses (DAA) increased 3.08% from 491,271 to 506,384.
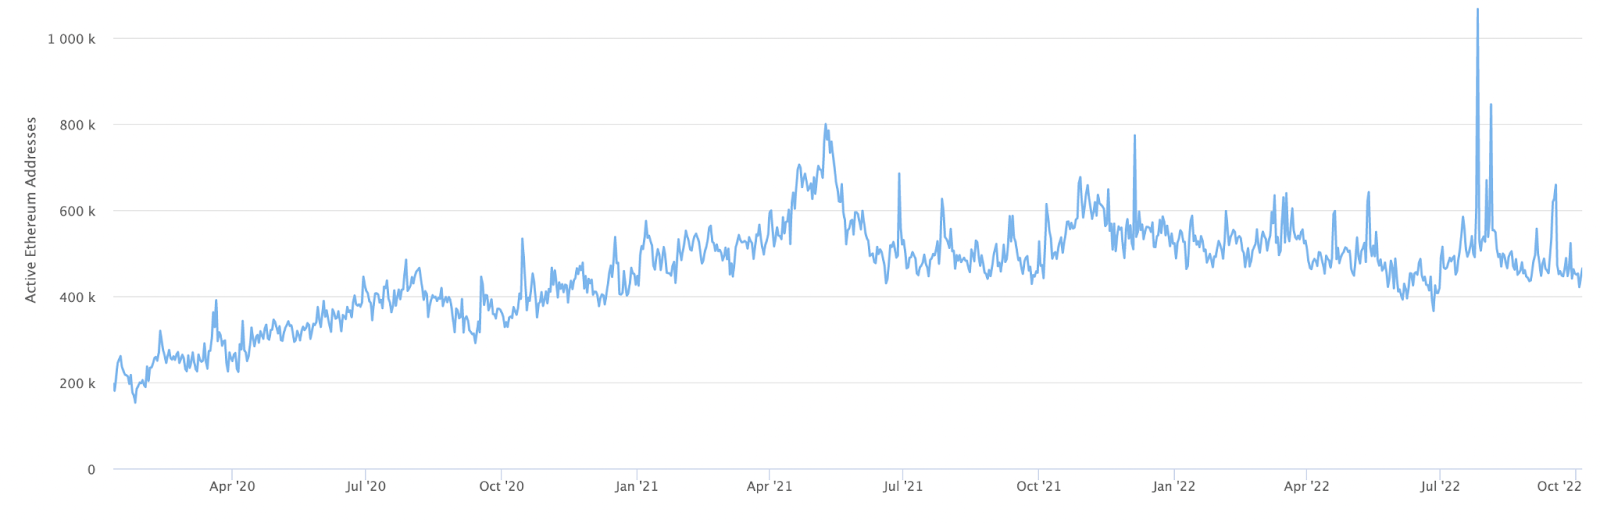
This measures the average number of unique wallet addresses to interact with the network for each day in the quarter.
Although overall speculative activity declined, this bump in DAA can likely be attributed to reduced gas costs. As the cost of transacting fell in tandem with blockspace demand, this increased the ability for new individuals, contracts, and/or bots to transact on Ethereum.
The number of ETH staked increased 80.2% from 7.81M to 14.08M.
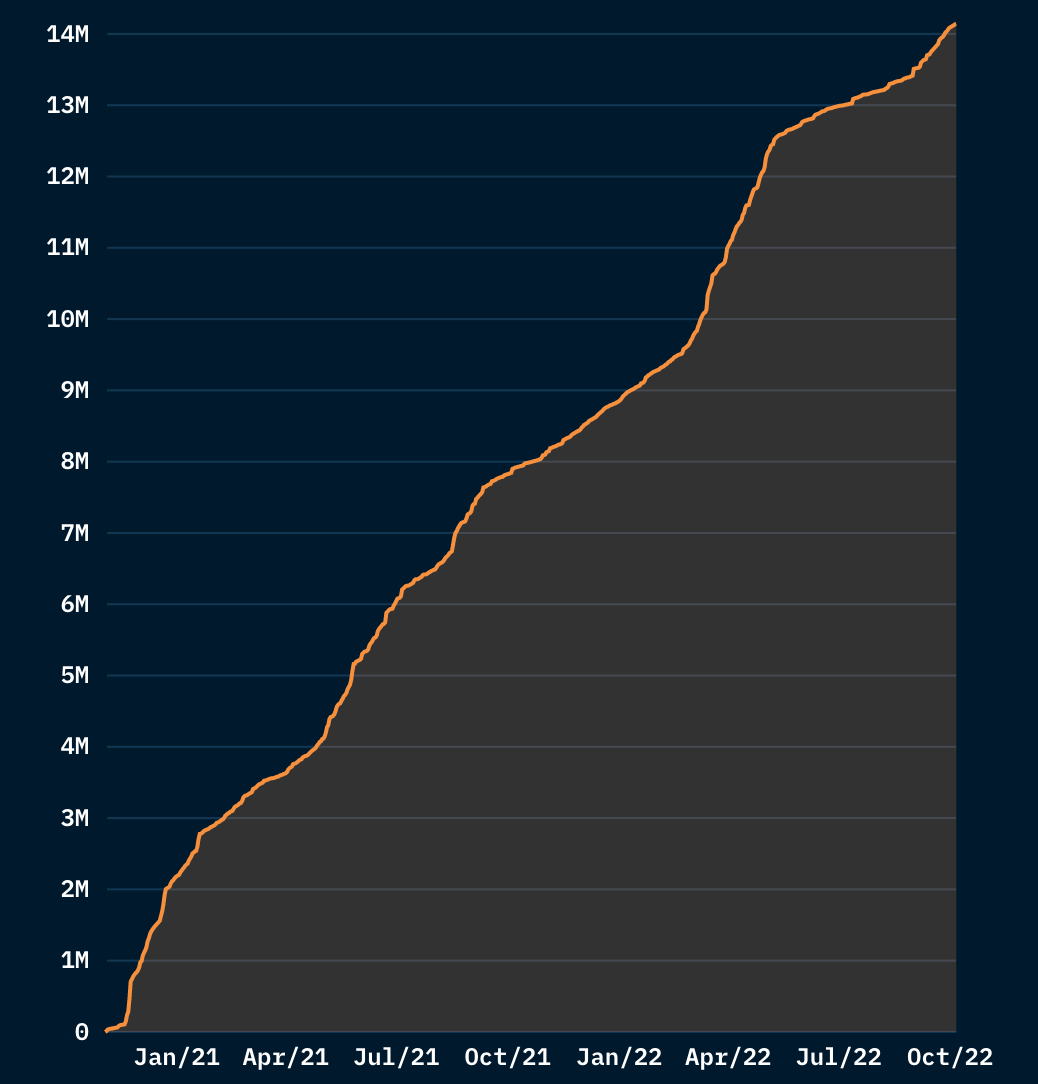
This tracks the amount of ETH staked on the Beacon Chain.
This growth in stake was due to anticipation of the merge, as well as the adoption of liquid staking services, which enabled users to earn staking rewards having their ETH holdings remain liquid. These protocols saw their share of total Beacon Chain deposits increase from 35.3% to 46.3% Y/Y.
🏦 DeFi Ecosystem
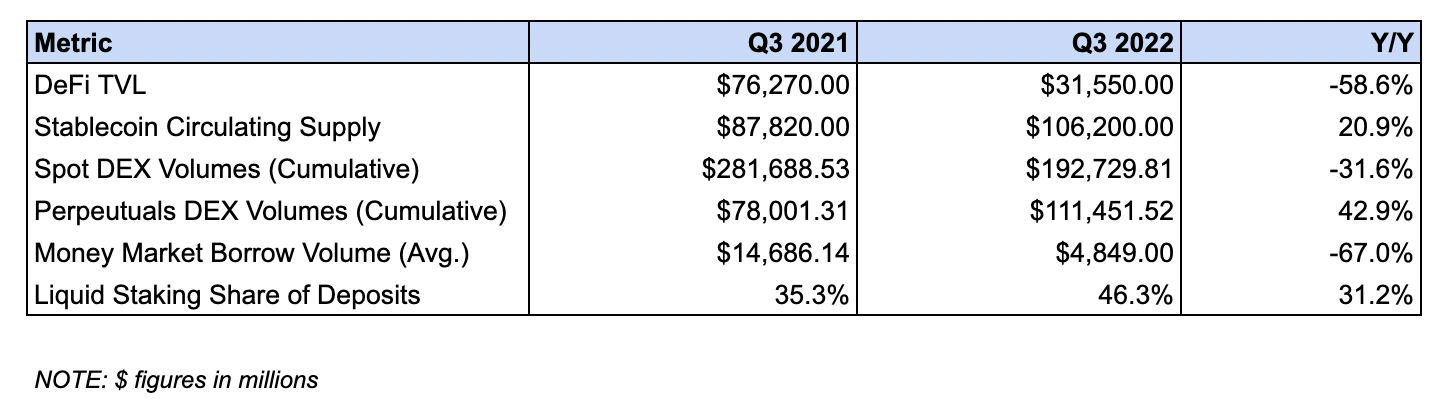
DeFi TVL shrank 58.6% from $76.27B to $31.55B.
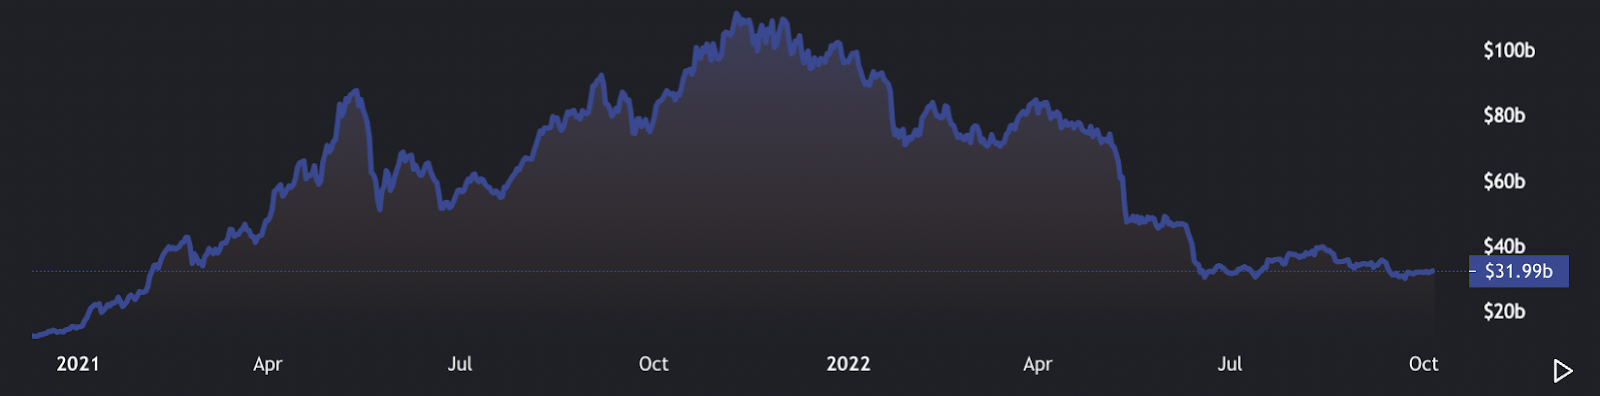
This measures the value of tokens deposited into Ethereum based DeFi protocols.
This decline can be attributed to bearish market conditions, as much of DeFi TVL is made up of volatile assets which have declined in price like ETH and wBTC. The drop is likely also fueled by liquidity outflows driven by the fall in on-chain yields which has made deploying capital less attractive.
Spot DEX volumes declined 31.6% from $281.68B to $192.73B.
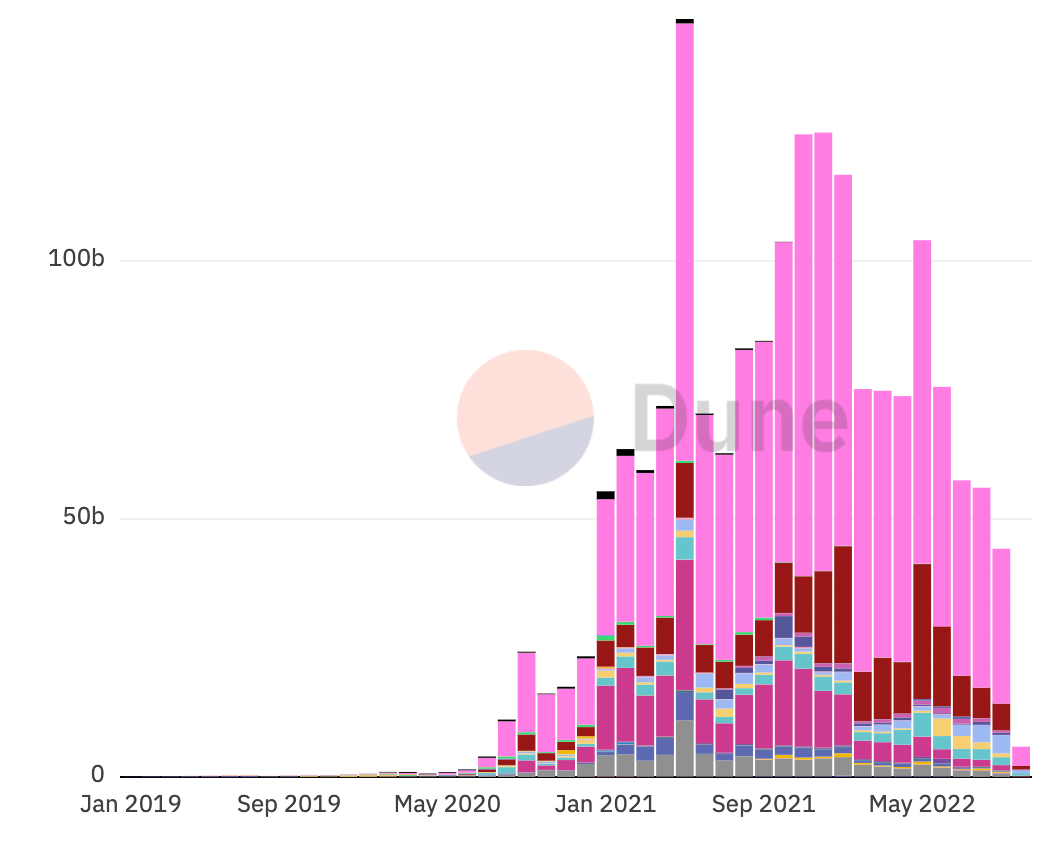
This tracks the total trading volumes across decentralized spot exchanges deployed on Ethereum.
This decline is likely attributed to slumping market conditions. As discussed above, bearish conditions have diminished demand to speculate, which given that trading activity is positively correlated to price action, has led to lower trading volumes.
Stablecoin Circulating Supply increased 20.9% from $87.82B to $106.20B.
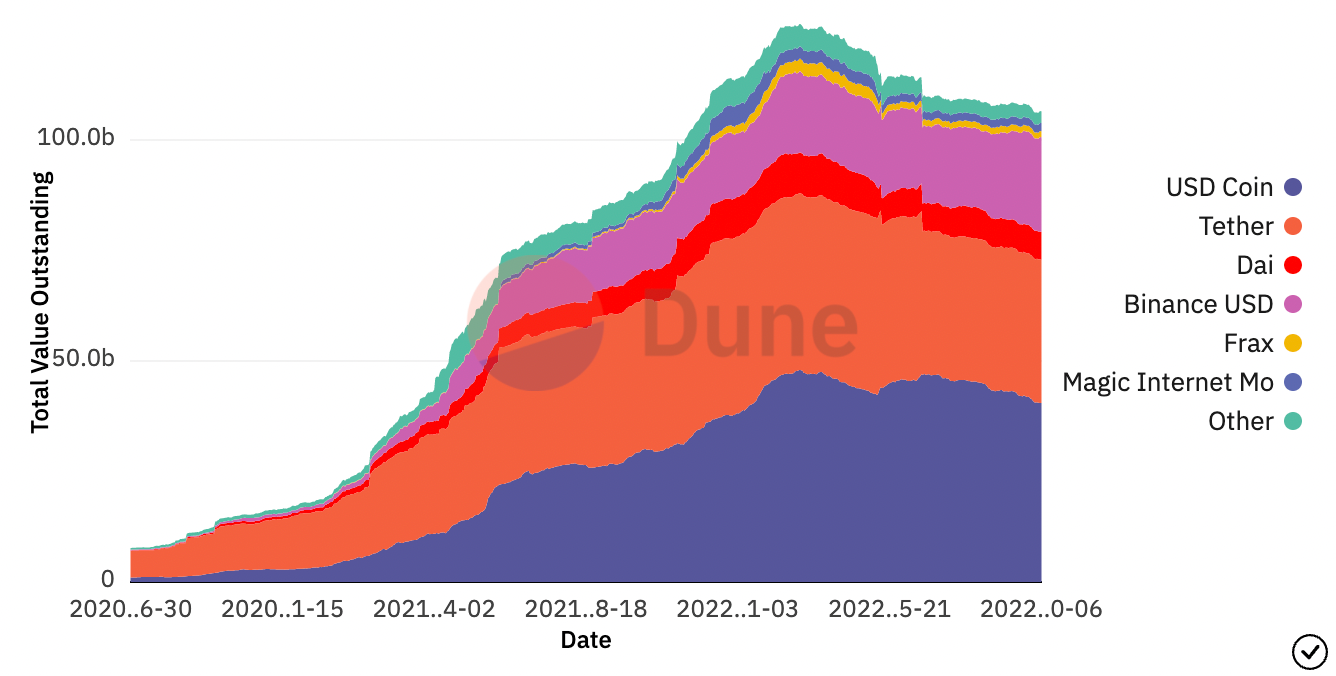
This measures the value of dollar-pegged stablecoins that are issued and/or circulating on Ethereum.
The growth has been driven by demand to hold stablecoins as cash positions and a combined $21.8B increase in the supply of USDC, BUSD, DAI and MIM on the network. This has offset a $3.6B decline in the circulating supply of USDT and “other” stablecoins.
Average Money Market Outstanding Debt fell 67.0% from $14.68B to $4.48B.
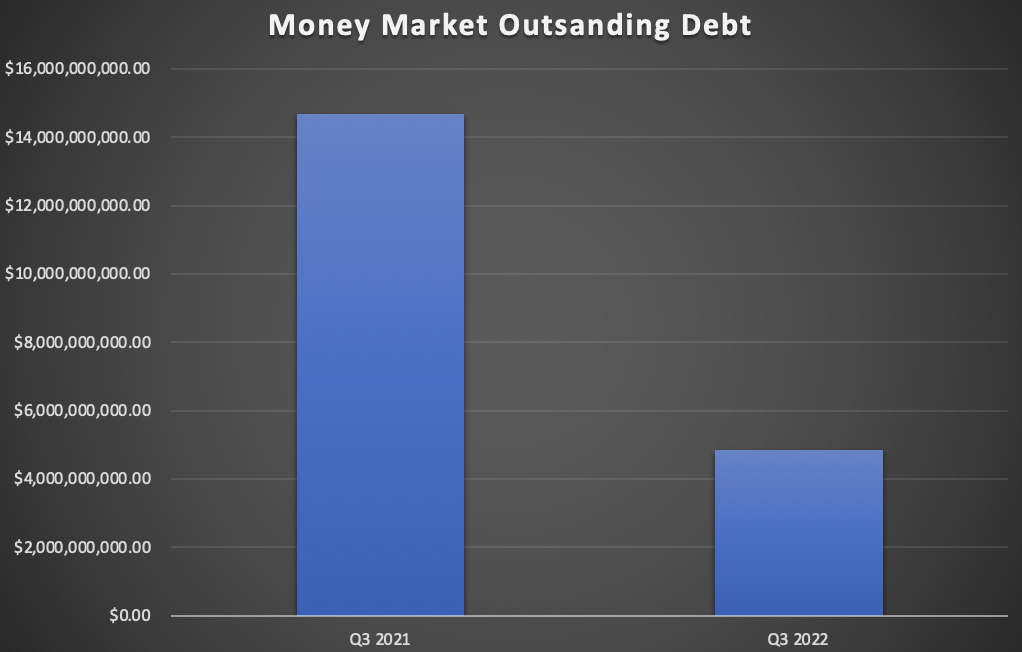
This tracks the average outstanding debt on Ethereum-based money markets over the course of the quarter.
This decline can be attributed to decreased demand for leverage as a result of market conditions. Furthermore, the appetite to borrow likely remained dampened despite a rise in the price of ETH due to the aftermath of the June deleveraging following the collapse of hedge fund Three Arrows Capital.
🎨 NFT Ecosystem
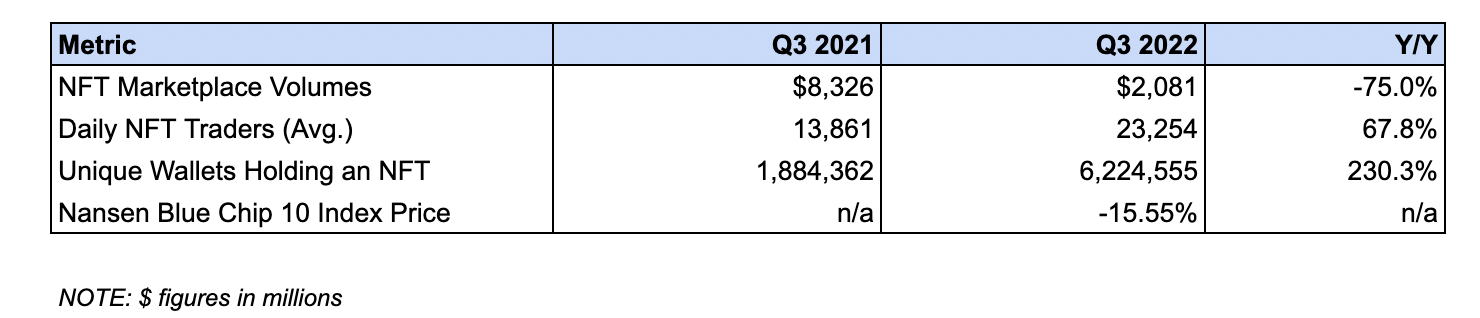
NFT Marketplace Volumes fell 75.0% from $8.32B to $2.08B.
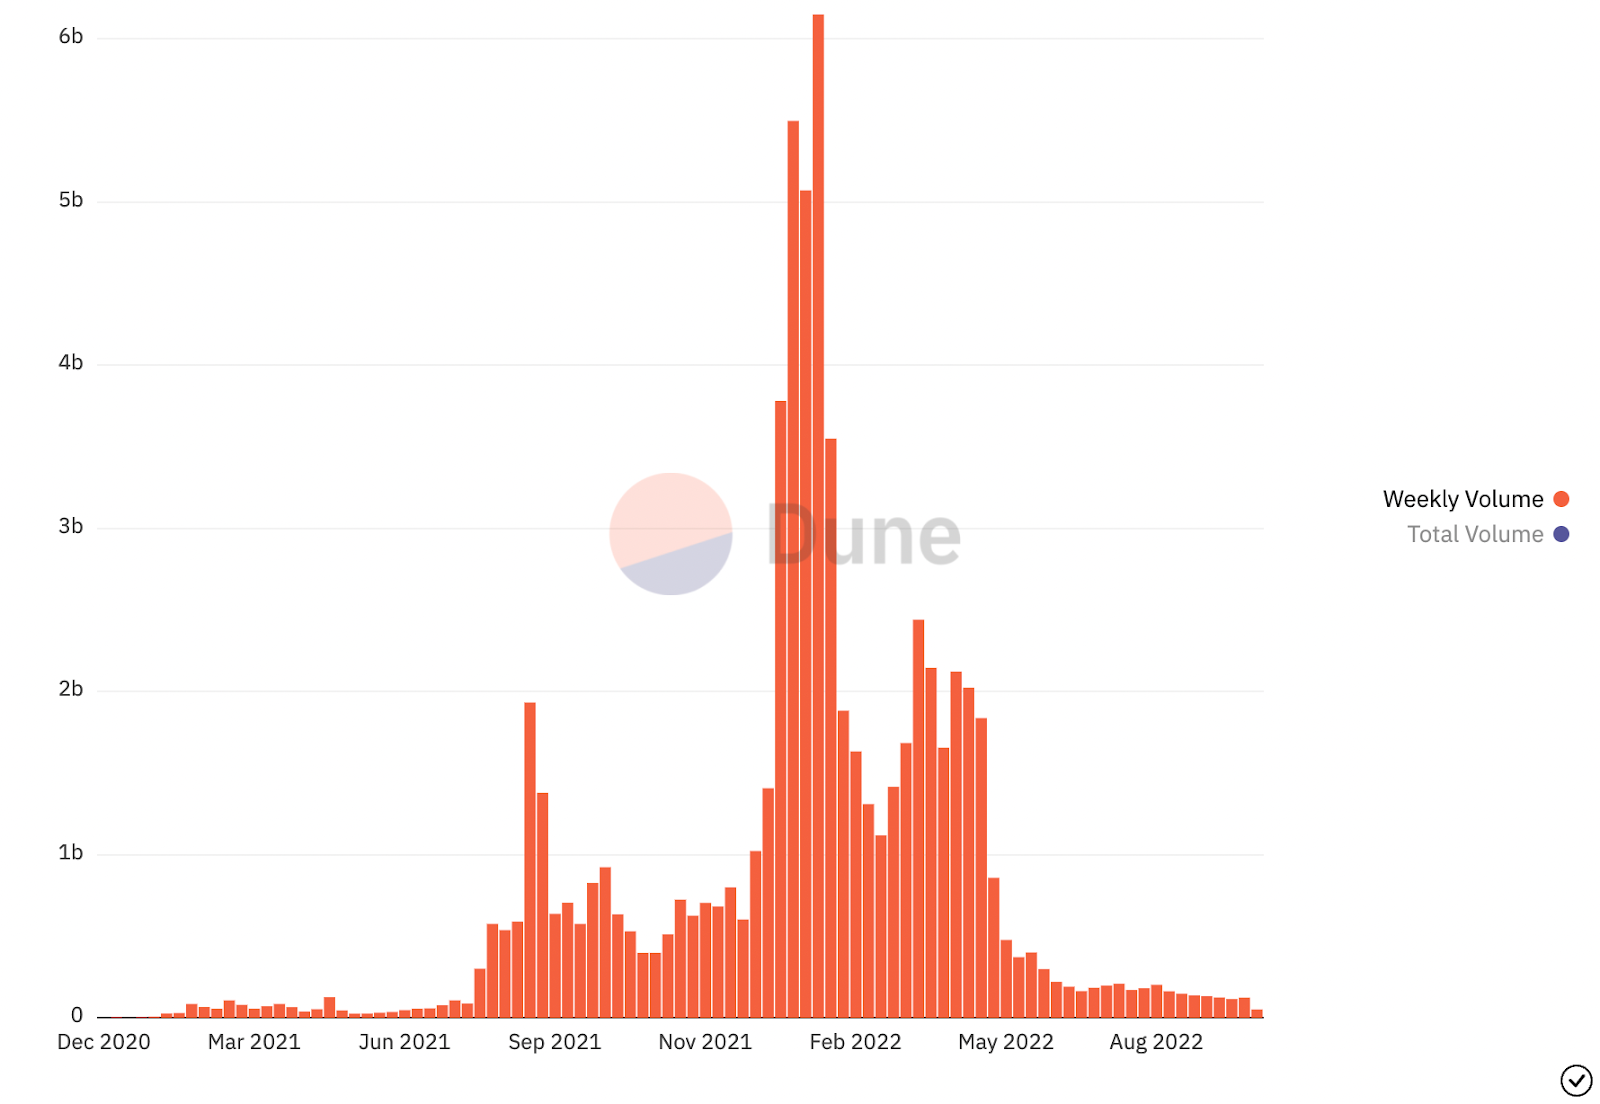
This measures the trading volume on NFT marketplaces such as OpenSea, LooksRare, and others.
The decline in trading activity can be attributed to weakness in the general crypto market, as well as due to a decrease in speculative activity as a result of cratering NFT prices. As with ERC-20s, NFT trading volumes are positively correlated to price action.
The Daily Average NFT Traders grew 67.8% from 13,861 to 23,254.
This measures the average number of users to trade NFTs each day during the quarter.
This bump is likely due to the broader awareness of the ecosystem among retail users as well as the maturity of NFT market structure.
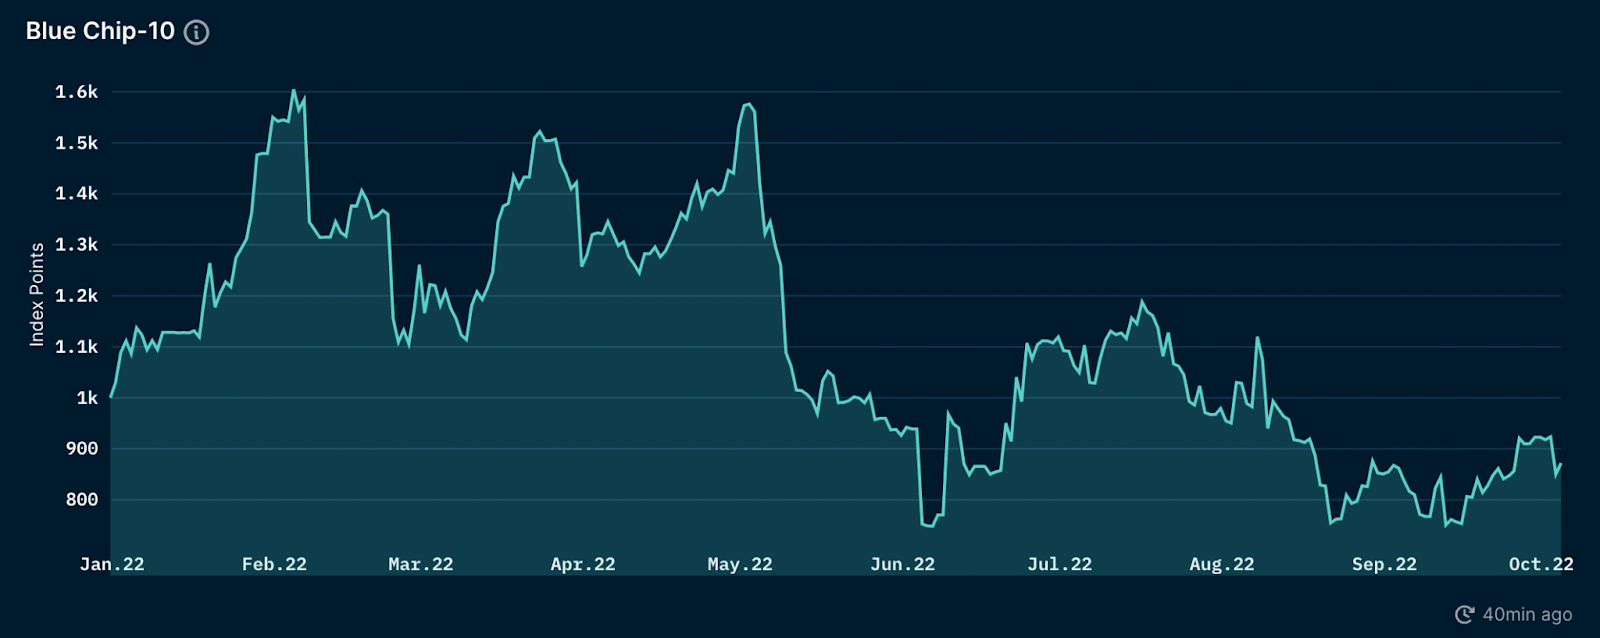
The Nansen Blue Chip-10 Index fell 15.5% in ETH terms.
The Blue Chip-10 is a market-cap weighted index that tracks the ten largest NFT collections,
Enjoying this article?
Subscribe to Bankless or sign in
This drop can likely be attributed to an increase in the price of ETH, which rose 24.43% during the quarter. NFT, of which almost all trade in ETH, have historically underperformed when the price of Ether increases, as traders are less inclined to part with an appreciating asset.
🔗 Layer 2 Ecosystem
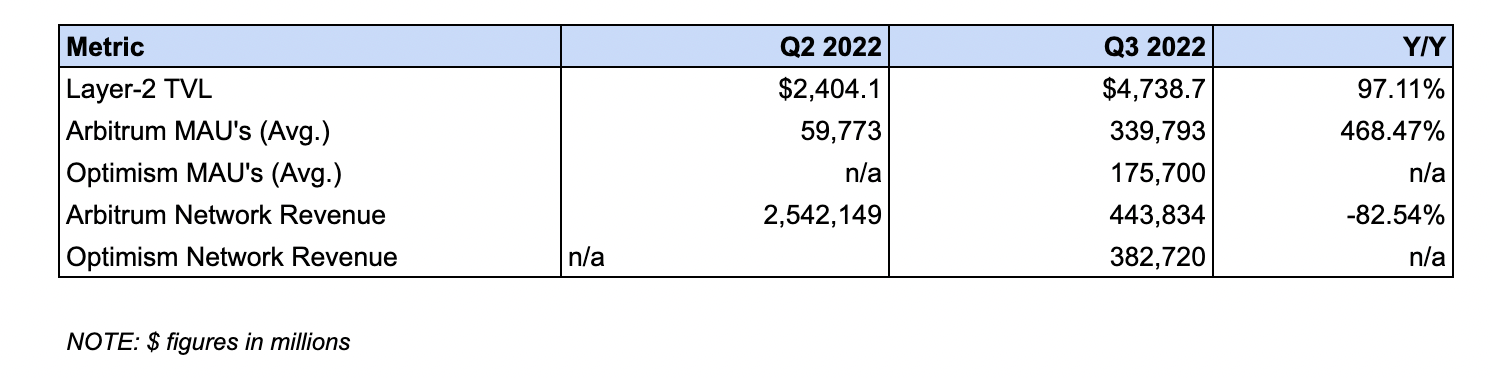
L2 TVL increased 97.1% from $2.40B to $4.73B.
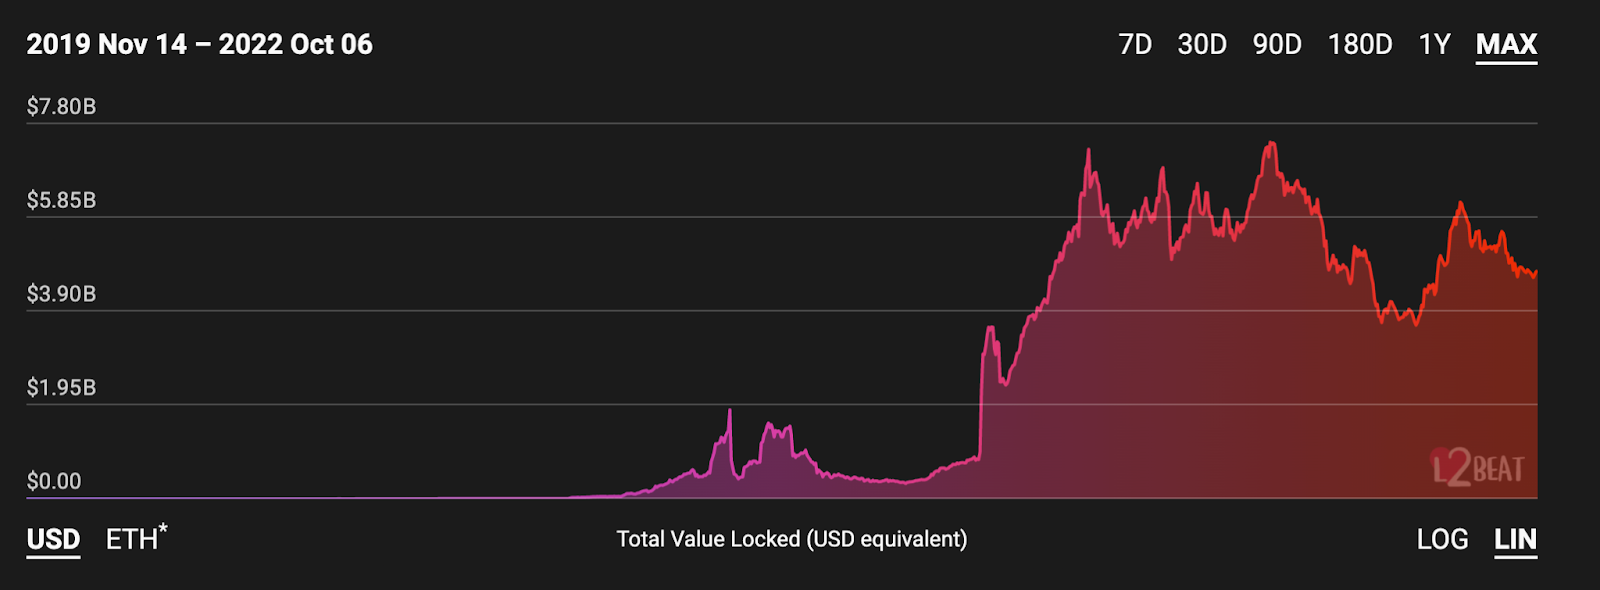
This measures the value transferred (through native or third-party bridges) onto optimistic rollups, zero-knowledge rollups, and validiums that settle to Ethereum.
This increase in TVL can largely be tied to liquidity inflows into generalized rollups, like ![]() Arbitrum and Optimism. The two combined hold ~$3.9B, which represents an 81.5% share of the value on these networks.
Arbitrum and Optimism. The two combined hold ~$3.9B, which represents an 81.5% share of the value on these networks.
The Average Monthly Active Addresses (MAA) on Arbitrum grew 468.5% from 59,773 to 339,793.  Optimism had an Average MAA of 175,700.
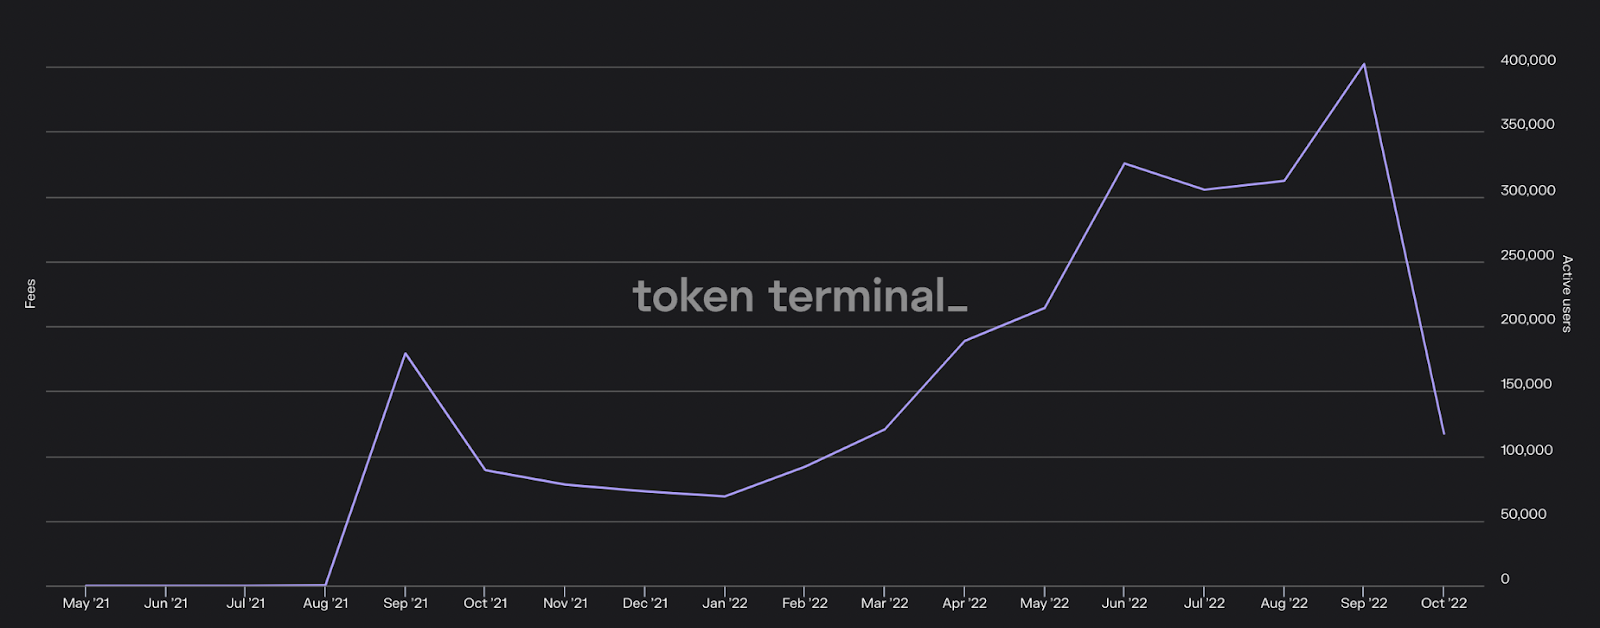
This measures the average number of wallets to transact on Arbitrum and Optimism each month during the quarter.
Arbitrum’s growth can be attributed in large part to the popularity of protocols such as perpetuals exchange GMX, whose deployment on the network has attracted $397.2M in TVL while facilitating $18.9B in trading volumes.
Network revenue on Arbitrum dropped 82.5% from $2.54M to $443K. Network revenue on Optimism was $382K.
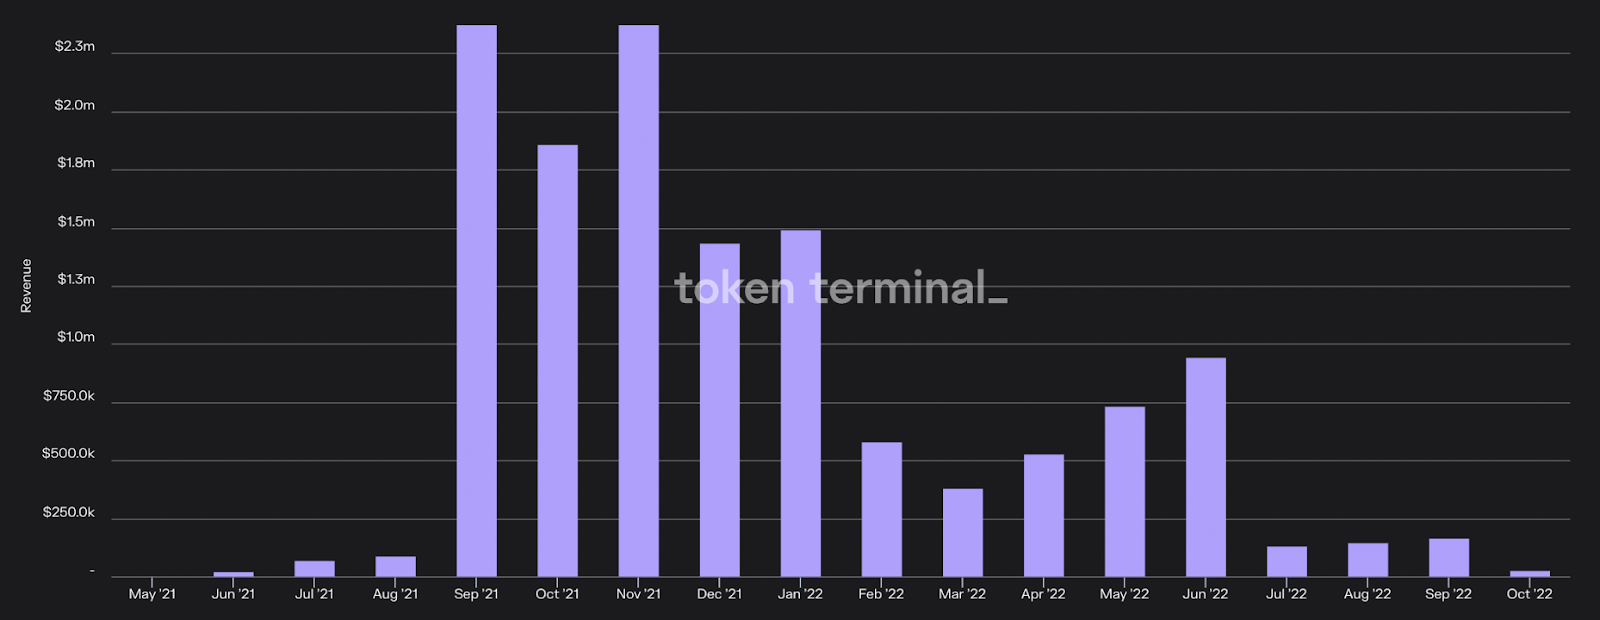
This measures the transaction fee revenue earned by the sequencer on Arbitrum and Optimism respectively.
Arbitrum’s decline in revenue can be attributed to reduced demand for blockspace. As with Ethereum, this is due to bearish market conditions and a substantial decline in speculative activity.
Note: Due to the limited publicly available historical data for Optimism, we are not able to make Y/Y comparisons for Average Monthly Active Addresses and Network Revenue.
🌐 Ecosystem Highlights
We Merged
After years of development and anticipation, Etheruem successfully merged from proof-of-work (PoW) to proof-of-stake (PoS).
While the post-merge dust has barely settled, we are already beginning to see the implications of the most significant upgrade in the network's history.
For starters, Ethereum’s energy consumption collapsed nearly overnight, decreasing 99.98% from 77.77 TWH to 0.01 TWH. This not only reduces the network's environmental impact, but should help increase the attractiveness of ETH among institutional TradFi investors with ESG mandates.
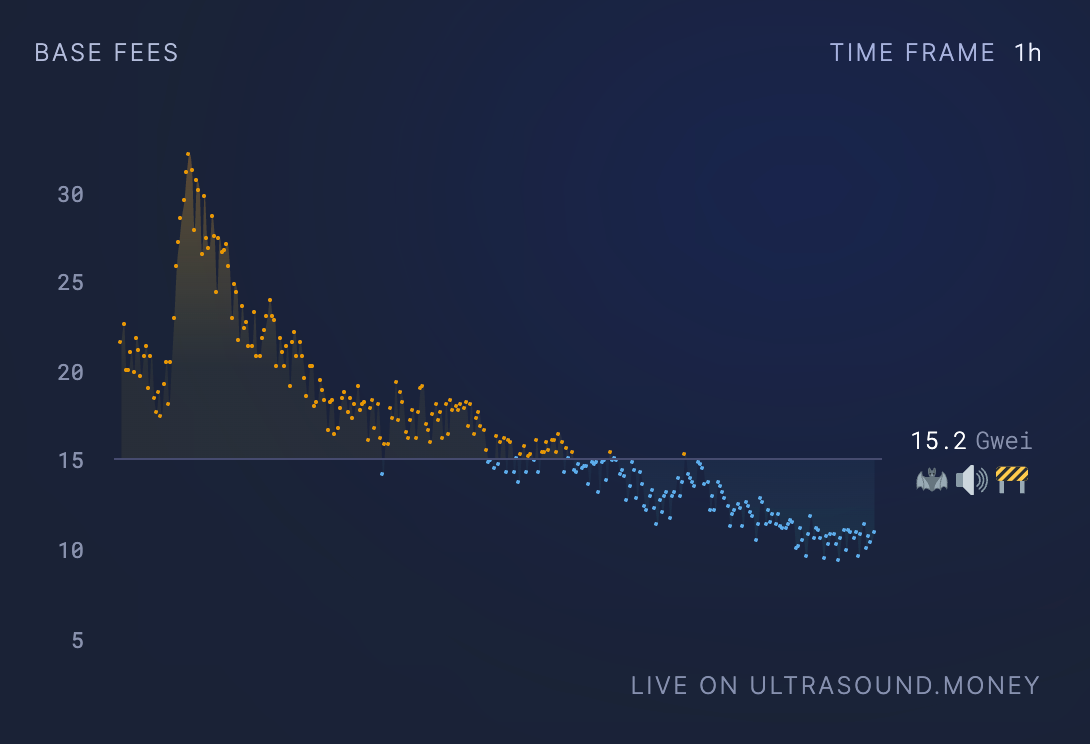
There has also been a similarly drastic reduction in ETH issuance, which has fallen 95.7% from from 3.76% to 0.17%. Despite the aforementioned low on-chain activity, we’ve even seen a few days of ultrasound Ether.
The merge has also begun to re-shape the blockspace economy, with the transition to PoS already changing the dynamics of the MEV sector through the introduction of proposer builder separation via MEV Boost, software developed by Flashbots that enables the separation of block building from block production. As of writing roughly 47% of blocks that are being produced are utilizing MEV Boost.
The merge has also begun to impact the staking sector. Staking yields have risen from ~3.5% to 5-6% since the event, as issuance is now supplemented with revenue from transaction fees and MEV, while deposits into liquid staking protocols have increased by 1.27%.
Further growth in the offerings of these protocols is likely to occur after the Shanghai network upgrade, which will enable withdrawals from staked ETH and is expected to go live within 6-12 months.
L2 Summer
Bankless may have been a year late, but we finally had the first iteration of Layer 2 summer during Q3 as both Optimism and Arbitrum, the two largest optimistic rollups, saw significant increases in both liquidity and community mindshare during the quarter.
Fueled by a rise in the price of OP and the rollout of incentives from their governance fund, Optimism’s DeFi TVL increased 234% from $274.46M to $916.97M in Q3. This jump, which occurred at the same time that at which many other networks saw their liquidity contract, saw the rollup to grow its market-share among all L1s and L2s from 0.51% to 1.56% during the quarter.
Arbitrum also saw its share of total DeFi TVL grow during the quarter, increasing from 1.33% to 1.78%. This growth was fueled by the rise of novel protocols such as perpetuals exchange GMX, helping fuel outperformance in Arbitrum ecosystem tokens. The L2 also shipped the Nitro network upgrade in August, which increased transaction throughput and lowered costs for end-users. Notably, Arbitrum’s growth has been entirely organic, as liquidity has been bootstrapped with no explicit token incentives.
Optimistic Rollups were not the only type of L2s to have a big Q3, as zkSync, Polygon, and ![]() Scroll all announced their plans to launch their zkEVMs on testnet or mainnet by the end of 2022.
Scroll all announced their plans to launch their zkEVMs on testnet or mainnet by the end of 2022.
The zkEVM is considered to be the holy grail of scaling, as it combines the network effects and developer tooling of the EVM with the increased transactional capacity of zkRollups. While it is unclear how they will perform in production, an impending zkEVM could shake up the increasingly competitive L2 landscape.
📅 Forward Outlook
There are numerous exciting developments within the Ethereum ecosystem that are poised to bolster the network’s long-run growth prospects.
At the protocol level, one exciting near-term upgrade is EIP-4844, which will introduce proto-danksharding, the precursor to danksharding. 4844, which may be implemented in the previously mentioned Shanghai upgrade, will introduce blob transactions, a new standard that will increase Ethereum’s capabilities of serving as a data availability layer by drastically reducing the cost of storing call-data on-chain.
The biggest beneficiary of the upgrade are L2s, as call-data storage is far and away the largest contributor to their cost structure. By making it less expensive to store data on-chain EIP-4844 should it be successfully implemented, will lower gas costs on these networks by orders of magnitude and increase the capability to growing usage of and migrate liquidity to L2s.
Another large infrastructure catalyst is the expected launch of Arbitrum’s token. The distribution of the token is likely to be revealed after Arbitrum Odyssey, an event intended to get users to interact with protocols on the network and that is expected to resume shortly now that the upgrade to Nitro is complete. Arbitrum’s token, which in part will likely be used for incentive programs by a variety of protocols, should help catalyze significant inflows into the ecosystem.
Despite these positive catalysts, there are several dark clouds looming over the ecosystem, with the most pressing being regulation.
The regulatory noose is tightening around Ethereum following the recent decision from OFAC to sanction the mixer Tornado Cash. This has led to an assortment of entities either freezing funds, blocking users or censoring transactions in order to comply. It remains to be seen how this, and other developments, such as the CFTC suing Ooki DAO tokenholders who have participated in governance, will impact Ethereum’s decentralization and credible neutrality moving forward.
Results Tables
Protocol
DeFi Ecosystem
NFT Ecosystem
L2 Ecosystem
About Ethereum
Ethereum is an open-source, decentralized blockchain network. Ethereum is a technology that's home to digital money, global payments, and applications. The community has built a booming digital economy, bold new ways for creators to earn online, and so much more. It's open to everyone, wherever you are in the world – all you need is the internet (Taken from the Ethereum.org website.)
About This Release
This release is not a release by Ethereum or the Ethereum foundation.
Action steps
- 📃 Review Ben’s previous State of Ethereum Q2 2022 report
- 📺 Catch Vitalik on the podcast on the future of post-Merge Ethereum
Author Bio
Ben Giove is an analyst for Bankless. He's the former President of Chapman Crypto and an analyst for the Blockchain Education Network (BEN) Crypto Fund, a student-managed crypto fund built on Set Protocol. He's also a proud member of the Bankless DAO and methodologist behind the GMI index
Subscribe to Bankless. $22 per mo. Includes archive access, Inner Circle & Badge.
🙏 Thanks to our sponsor FUEL
👉 Explore the FuelVM and discover its superior developer experience!
Want to get featured on Bankless? Send your article to [email protected]
Not financial or tax advice. This newsletter is strictly educational and is not investment advice or a solicitation to buy or sell any assets or to make any financial decisions. This newsletter is not tax advice. Talk to your accountant. Do your own research.
Disclosure. From time-to-time I may add links in this newsletter to products I use. I may receive commission if you make a purchase through one of these links. Additionally, the Bankless writers hold crypto assets. See our investment disclosures here.